
Why BBT Charting Changes Everything
A blood test gives you a single snapshot in time. Your BBT chart gives your practitioner a 28-day hormonal movie — showing exactly how your follicular development, ovulation, and luteal phase are functioning in real life, not just on one day in a clinic.
Three cycles of charting gives your practitioner a longitudinal view of your HPO axis function — revealing patterns in follicular development, ovulation quality, corpus luteum output, and endometrial preparation that no single blood test can capture.

The Four Phases of Your Cycle
Select each phase to explore the hormonal activity, BBT pattern, and what your practitioner looks for.

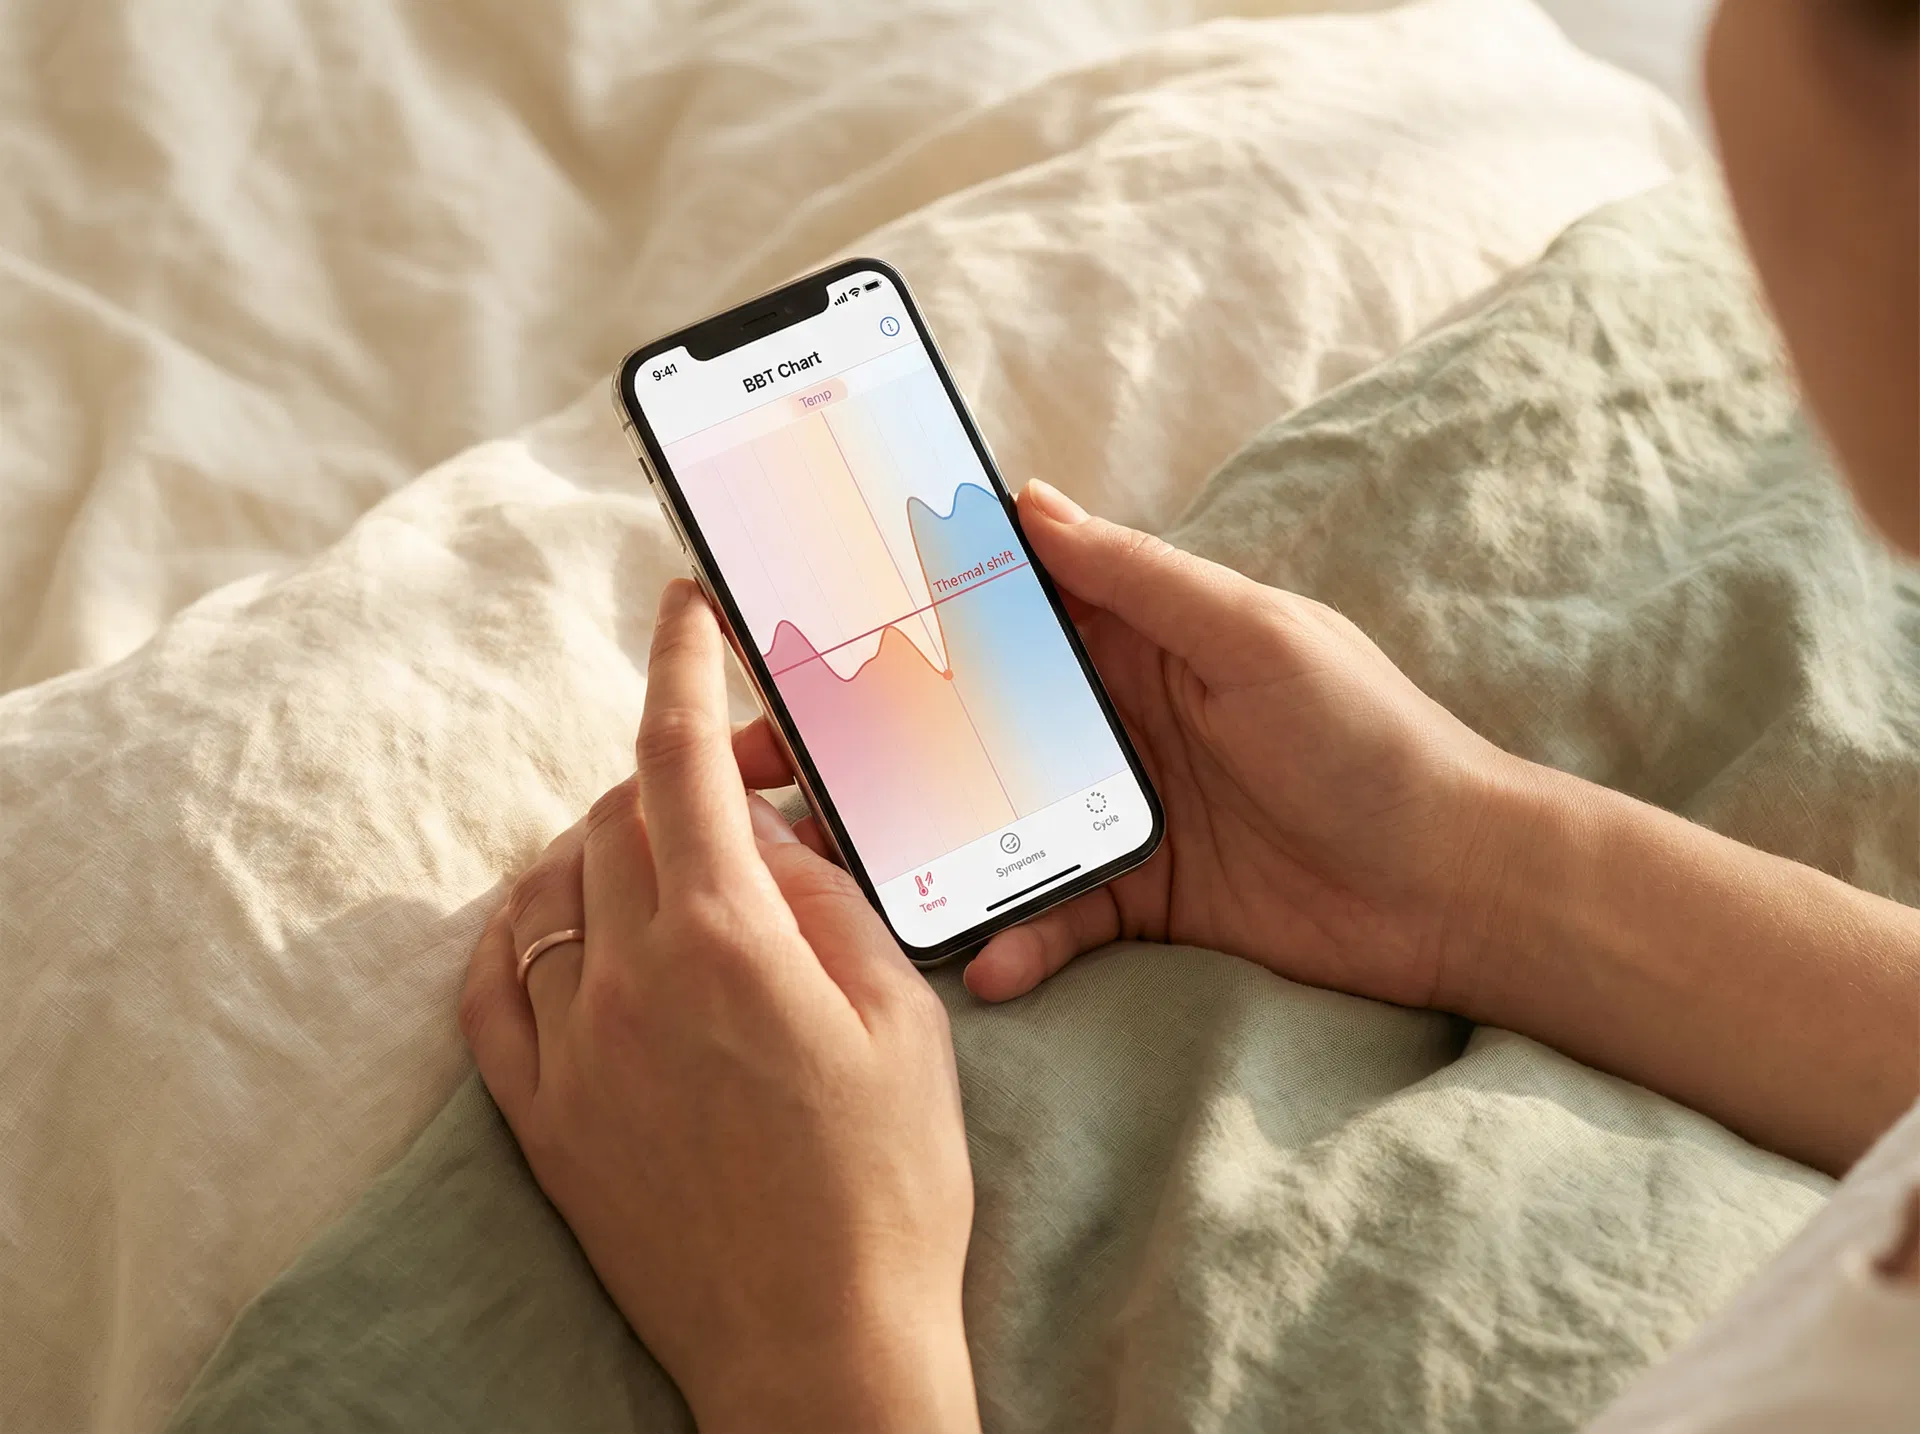
The Interactive BBT Chart
Hover or tap any data point to decode what is happening hormonally on that cycle day. This is a healthy, textbook 28-day cycle.
Watch: How to Take Your BBTHover or tap any data point on the chart above to decode what is happening on that cycle day.
Reading the Signs
Learn to distinguish a healthy chart from one that signals an issue worth discussing with your practitioner.
Getting Started with Fertility Friend
Fertility Friend is the free app your practitioner recommends for BBT charting. The free version has everything you need. Follow these six steps to set it up correctly from Day 1.
Download Fertility Friend
Available free on iOS and Android. Create an account — the free version is sufficient for BBT charting. You do not need to upgrade to VIP.
Visit Fertility FriendSet your cycle start date
Enter Day 1 as the first day of full flow (not spotting). This anchors your entire chart to the correct cycle day.
Take your temperature correctly
Take your BBT every morning at the same time, immediately upon waking, before getting out of bed or speaking. Use a BBT-specific thermometer (2 decimal places). Record even if you slept poorly — note it in the app.
Watch: How to Take Your BBTLog your temperature daily
Enter your temperature in the app each morning. Tap the temperature field and enter your reading. The app will begin plotting your chart automatically.
Add observations
Log cervical mucus (dry, sticky, creamy, watery, egg-white), cervical position if you check it, and any relevant symptoms (cramping, spotting, illness, alcohol, poor sleep). These notes are invaluable for your practitioner.
Share your chart
Your practitioner can view your chart via the sharing feature. Go to Settings → Chart Sharing and share the link. Bring your chart to every session — it tells a story no blood test can.
What Your Practitioner Looks For
Your BBT chart is reviewed at every coaching session. Here is what your practitioner is specifically analysing — and why it matters for your protocol.
Follicular phase temperature stability
Erratic low-phase temps can indicate thyroid dysfunction, poor sleep quality, or adrenal stress — all of which impair follicular development.
Quality of the thermal shift
The speed and magnitude of the shift reveals progesterone output. A slow, gradual rise suggests the corpus luteum is underperforming.
Luteal phase length
A luteal phase under 10 days is a luteal phase defect. This is one of the most common and most treatable causes of implantation failure.
Pre-menstrual spotting pattern
Spotting 3+ days before full flow in the luteal phase is a progesterone insufficiency signal. Herbal and nutritional support can significantly improve this.
Response to treatment
After 1–2 cycles on a targeted protocol, your chart should show measurable improvement — a clearer shift, longer luteal phase, or reduced spotting. The chart is your progress report.
Cycle length consistency
Highly variable cycle lengths (>5 days variation) suggest HPO axis dysregulation. This is common in PCOS, high stress, and perimenopause.
Your Action Plan
Tick each item as you complete it. Bring this checklist to your next coaching session.